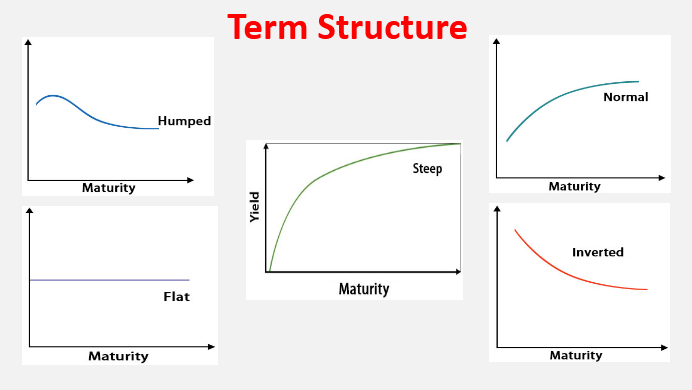
The yield curve is a graph that plots the yield of various bonds against their term to maturity.
It has many uses:
– Setting the yield for all debt market instruments,
– Acting as an indicator of future yield levels,
– Measuring and comparing returns across the maturity spectrum,
– Indicating relative value between different bonds of similar maturity,
– Pricing interest rate derivative securities.
Yield curve takes different shapes. More formal mathematical descriptions of this relation are often called the term structure of interest rates.

There are various economic theories to explain the yield curve. Basically, the return on a long‐dated bond should be equivalent to rolling over a series of shorter‐dated bonds. If we have a positively sloping yield curve, it means that the market expects spot interest rates to rise. Likewise, an inverted yield curve is an indication that spot rates are expected to fall.
Yield curve is important for policy makers but they neglect it until it forces itself on their attention. What they should know is that macroeconomic factors lead to changes in yield curve factors or vice versa. Economically, this kind of relationship is a function mainly of the expected rate of inflation. If the market expects inflationary pressures in the future, the yield curve will be positively shaped, while if inflation expectations are inclined towards disinflation, then the yield curve will be negative.
High downward‐sloping curve is taken to mean that tight credit conditions will result in falling inflation.
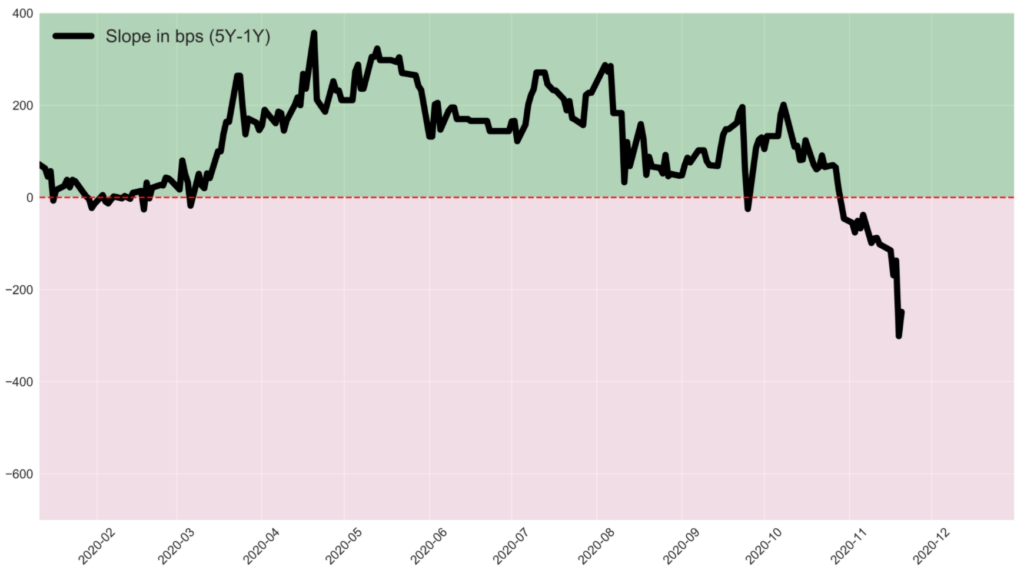
Inverted yield curves have often preceded recessions. Empirically slope of the yield curve is related to the industrial production, output gap, capacity utilization rate and fiscal deficit.
Central Bank of Turkey economists also have shown that the slope factor is found to be correlated with the economic activity. The slope turns out to be negative during global financial crisis and in second half of 2016, which are marked by contracting economic activity in Turkey, while it rebounds in other periods.

Last time the yield curve was inverted deeply in 2018 August, industrial production slowed markedly until 2019 August.

Last week, Central Bank of Turkey increased the policy rate (one-week repo auction rate) from 10.25 percent to 15 percent, and decided to provide all funding through the main policy rate, which is the one-week repo auction rate. As the average cost of funding of the central bank was at 14.80 percent already, this modification has a meaning more than increasing short term interest rates by 20 basis points.
Yield curve tells us that economy policy makers of Turkey shifted from impossible monetary trinity policy making towards economic depression. This shift was unavoidable but it is questionable whether new policy framework is sustainable given the underlying economic weakness.

